This is a study regarding the contextualization of the Kvamme Gain statistic, the evaluation of its characteristics, and justification for replacing it with the Youden’s J statistic for the evaluation of archaeological predictive models (APM) effectiveness based on single value metrics. This analysis is divided into two blog posts. Part 1 discusses the use of evaluation metrics, the characteristics of the Kvamme Gain (KG) statistic (the most common metric used to evaluate APMs), and then links the KG to the framework of the Confusion Matrix as a tool for evaluating classification problems. A Confusion Matrix is simply a 2 by 2 contingency table of correct and incorrect predictions. By placing the Kvamme Gain in the framework of the confusion matrix we can link the poorly studied task of APM quantitative evaluation to the very well-studied task of machine learning classification model evaluation. While archaeological data has unique characteristics that we will need to consider, the task of evaluating binary and multi-class classification is well documented and not unique to archaeology.
Part 2 of this post (not yet published) will then look at the characteristics of the KG and reveal some qualities that make is less appropriate for its use as a single value to evaluate APM. These qualities will be compared to the Youden’s J statistic and I will try to make a case for why it should be the primary APM statistic. The characteristics and relationship between these two metrics will be explored graphically to try to make some intuition regarding their usefulness.
Note: I strongly feel that a suite of appropriately chosen metrics is the most useful for evaluating model performance. However, boiling threshold-based classification performance down to a single number is a very common practice; so let’s do it the best we can.
“The key to keeping your balance is knowing when you’ve lost it” ~ Anonymous
So many metrics, so little time…
Archaeological Predictive Models, as well as all predictive models, typically require the quantification of their predictions in order to assess validity. Simple enough, right? Not so much. There are a multitude of metrics, methods, tricks, and approaches to distilling a predictions accuracy (using that term here in its broadest sense) to a single number that has meaning for the prediction task at hand and the audience it is communicated to. Some metrics include simple accuracy (used here in its narrow form) as the % correct over the % incorrect, to the more elaborate Root Mean Square Error (RMSE), to more exotic things like entropy. Each of these metrics, and a dozen more, have distinct characteristics that lend themselves to different problems and objectives. However, it is suffice to say that there is no one correct metric to use in all, or even a majority of analytical problems. This is because there will always be a loss of information when multiple and often competing measurements are summaries into a single number. Yet we have a strong desire to condense complex information into an easily digestible unitary calculation regardless of the waste of valuable context. Despite the apparent diversity and flexibility of many metrics, the blind application of any one performance metric to a predictive problem is a pretty quick way to end up with uninterpretable results that may not address your research or conservation goals.
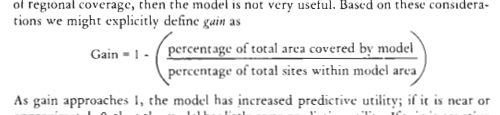
Origins of the Kvamme Gain Statistic
In the case of most applications of APM, there are a set of constraints that are somewhat unique and require some thought about what metric best illuminates the results. In a 1988 publication [see here for review and download] Dr. Kenneth Kvamme described an evaluation metric for binary (i.e. thresholded) APMs: